


conductor Index rose 92.5% over twelve weeks, investors began taking profits in several of the market’s largest AI beneficiaries. Volatility increased as enthusiasm met questions about how much future growth had already been priced in.
Yet the pullback remained contained. Strengths in healthcare, industrials, and financials helped offset weakness in large-cap technology. For much of the year, market gains were concentrated in a relatively small group of large technology companies. June suggested that leadership may be broadening, with several sectors participating without the broader market giving back much ground. A market supported by more than one theme is generally healthier than one dependent on a single trade continuing to exceed already high expectations.
Equity markets have climbed in recent weeks, with the S&P 500 near record highs after a rare nine-week winning streak. The rally has been supported by strong AI-driven earnings, demand for computing power, and a mostly constructive economic backdrop.
Still, this is not a risk-free environment. Valuations are elevated, oil remains near $100, the Strait of Hormuz remains closed, and inflation and interest rates remain important variables for the year ahead. The key question is whether the market is pricing in too much good news.
Our answer is: in some areas, perhaps, but not enough to justify a significant change in allocation. Valuations deserve attention, but they should not be treated as market-timing tools. P/E ratios can help frame long-term return potential and downside risk, but they have historically been poor guides for deciding when to enter or exit the market.
What Actually Moved
Two developments shaped June beyond the rotation in technology.
First, Treasury yields rose early in the month amid stronger economic data and renewed inflation and rate concerns tied in part to the oil-price spike from the Iran conflict. As tensions began to ease, oil prices started to normalize, and central-bank expectations shifted. Treasury yields later eased, reminding investors that short-term rate narratives can change quickly when they are tied to fast-moving geopolitical events.
Second, the IPO market reopened in earnest. SpaceX’s public offering in June and its rapid inclusion in the Nasdaq-100 in early July underscored investor appetite for large, AI-adjacent growth businesses. Its trading since the listing also showed the other side of the story: even highly anticipated companies can face meaningful swings once public-market valuations, execution, and supply dynamics are tested.
That matters because additional large offerings could add equity supply to a market already concentrated in a handful of growth themes. Faster index inclusion may also bring newly public companies into passive portfolios more quickly than in prior cycles. The point is not that these businesses are unattractive, but that investors should distinguish between a compelling company and an attractive investment at a particular price.
Valuations remain elevated, and concentration compounds the issue. The ten largest S&P 500 companies now account for nearly 40% of the index’s total value. Elevated valuations do not predict an immediate correction, but they do narrow the margin for error. The relevant question is whether earnings growth and cash flow can meet the expectations already embedded in current prices. June’s semiconductor pullback showed how quickly sentiment can reset when investors begin to question that answer.
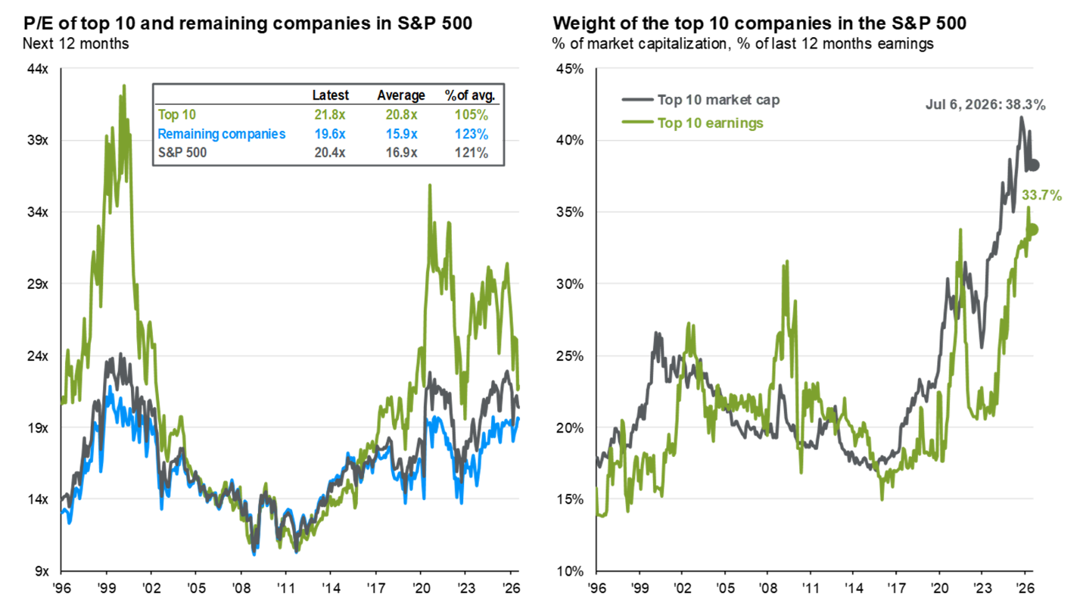
Source: FactSet, Standard & Poor’s, J.P. Morgan Asset Management. Forward P/E ratio is the most recent price divided by consensus estimates for earnings in the next 12 months, provided by IBES since January 1996 and FactSet since January 2022. The remaining stocks represent the rest of the 490 companies in the S&P 500, and their P/E ratio is calculated by backing out the nominal earnings and market cap of the top 10 from that of the S&P 500. Guide to the Markets – U.S. Data are as of July 6, 2026.
International equities offer one way to address that concentration. Non-U.S. markets have performed well since 2025 and still trade at a meaningful valuation discount to U.S. equities. If the dollar continues to weaken from elevated levels, international exposure may provide another source of return and diversification.
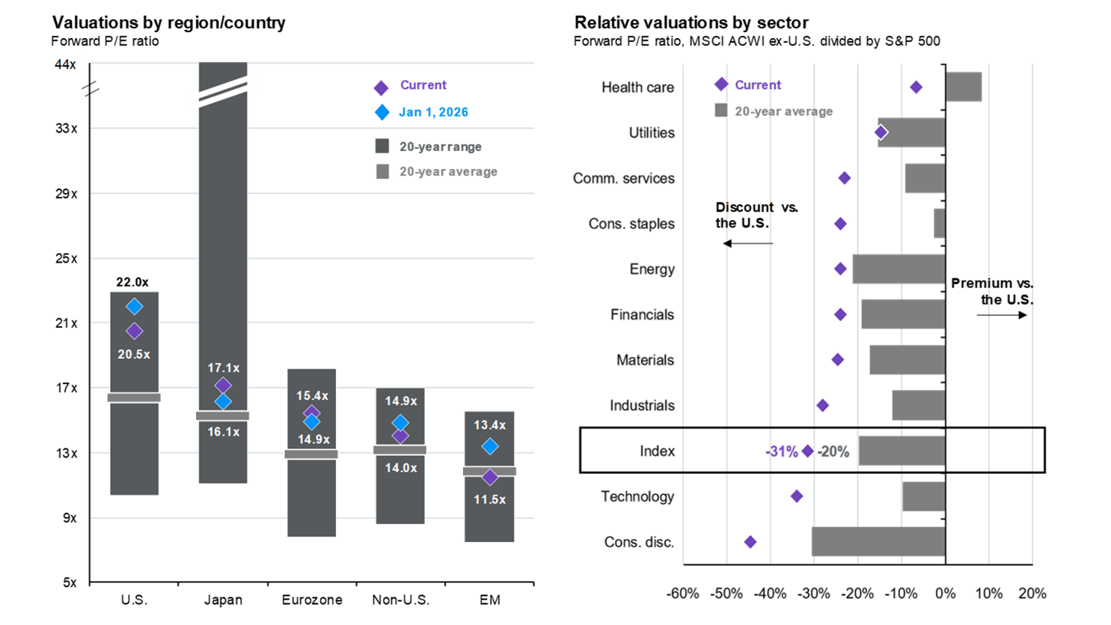
Source: FactSet, MSCI, Standard & Poor’s, J.P. Morgan Asset Management. All return values are MSCI Gross Index data, except the U.S., which is the S&P 500. Non-U.S. is MSCI AC World ex USA Index. *Multiple expansion is based on the forward P/E ratio, and EPS growth outlook is based on next 12 months earnings estimates. Chart is for illustrative purposes only. Past performance is no guarantee of future results. Guide to the Markets – U.S. Data are as of July 6, 2026.
A Final Thought
The economic backdrop remained resilient through June, supported by AI infrastructure investment, productivity gains, and lower oil prices. The economy remains neither overheating nor contracting, while inflation remains the central variable for policymakers and markets.
Three themes are likely to shape the second half of the year: the continued AI buildout, the Federal Reserve’s policy path under new leadership, and midterm-election uncertainty. Each may create periods of volatility. More important, however, will be whether corporate earnings, inflation, and investment spending continue to support the market’s underlying fundamentals.
For investors, the practical question is whether portfolios have become overly dependent on a small group of U.S. mega-cap companies or a single AI-related spending cycle. Broader sector exposure, international diversification, and high-quality bonds can help reduce that dependence while preserving participation in long-term growth opportunities.
As always, please reach out with any questions. Thank you for your continued trust
Warmest regards,
Sathya & Steve
Content in this material is for general information only and not intended to provide specific advice or recommendations for any individual. All performance referenced is historical and is no guarantee of future results. All indices are unmanaged and may not be invested into directly. The economic forecasts set forth in this material may not develop as predicted and there can be no guarantee that strategies promoted will be successful.


